|
<< Click to Display Table of Contents >> Graphical dialogs |
  
|
|
<< Click to Display Table of Contents >> Graphical dialogs |
|
Most component design step dialogs contain 2D graphical representation. The user interface is uniform concerning the following topics.
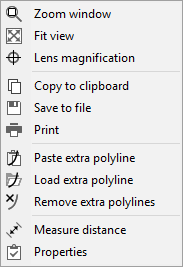
All graphical representations are made in diagrams that are automatically scaled according to displayed objects. All diagrams have a popup menu (right click on empty diagram area) with basic functions. Alternatively you can use the buttons on the top side of the diagram:
|
•Zoom window by mouse •Fit view •Lens magnification at mouse cursor position •Copy diagram to clipboard •Save diagram as BMP, GIF, JPG, PNG or WMF •Print diagram •Paste points from clipboard into an extra polyline •Add any polyline from file (x,y points) to compare different curves (alternatively by drag & drop) •Remove all imported polylines •Measure distance (use left-click to define start position and keep the button pressed until the mouse cursor reached the end position) •Configure diagram |
If the mouse cursor is moved over a graphical object (e.g. polyline, Bezier point) then this is highlighted by color or by increased line width. Right mouse click is now related to this object and does open a special popup menu or a small dialog window for data input.
Bezier curves are used for geometrical contours by default. This continuous polylines are described by the position of a few Bezier points. Therefore a simple modification of the curve is possible but on the other hand the numerical representation of the curve is accurate. For Bezier curves, popup menus are available for special actions concerning the curve.
|
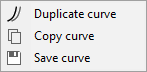
In addition to specific curve features, the context menu always contains some general features: •Duplicate curve: The selected curve is duplicated to better illustrate subsequent modifications of the original curve. •Copy curve: 100 points (1 point per line, x and y separated by tab) of the selected curve are copied into the clipboard for further processing in other applications. •Save curve: 100 points (1 point per line, x and y separated by tab) of the selected curve are saved into a text file. |
|
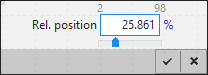
An alternate method to specify control points position by the mouse, you may enter the accurate coordinates of the point in a small dialog window that appears by clicking the right mouse button on the chosen control point. |
One or two coordinate values can be entered in dependence of geometrical boundary conditions. As a rule these values are normalized relative values describing the position of the point between extreme values left or bottom (0) and right or top (1). Normalized relative coordinates are giving the advantageous possibility of an automatic update of the entire design if a parameter is modified.
|
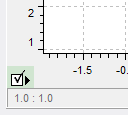
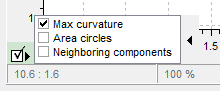
Some diagrams (both main and additional progression diagrams) have several display options to switch on/off some elements. These display options can be handled by a menu in the lower left corner of the diagram. The state of each display option is saved internally and restored next time. |
•Coordinates of mouse cursor are displayed in format x:y bottom left in the status bar.
|
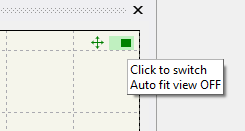
For docking diagrams, automatic fit view can be switched on/off in the upper right corner when moving the mouse over the diagram. |